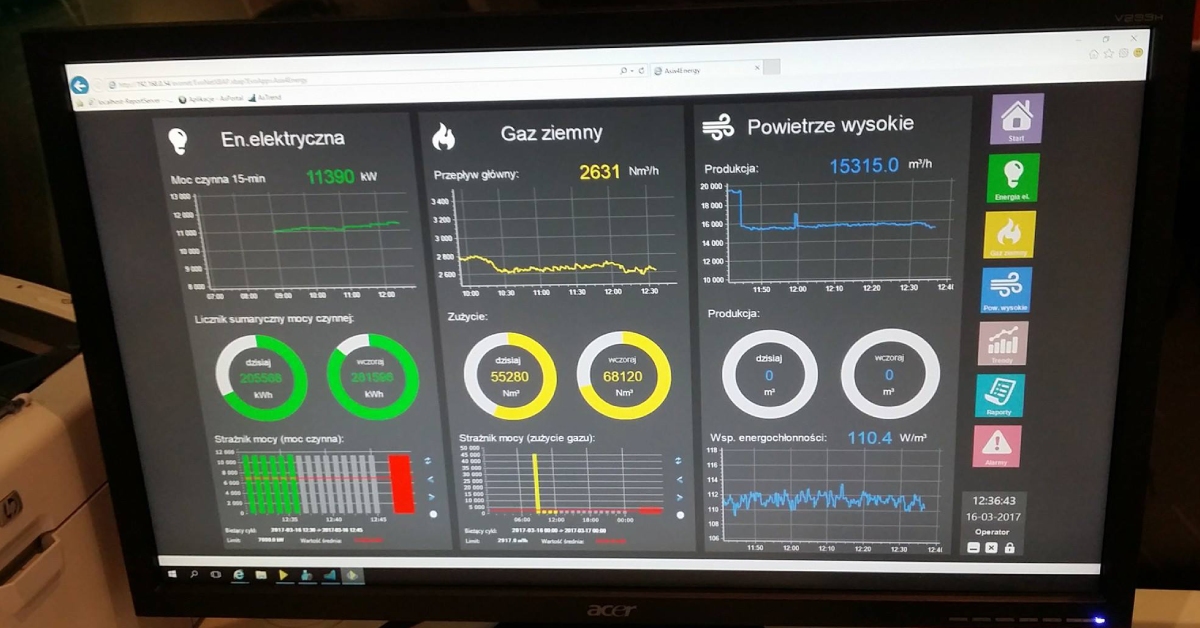
Contrary to appearances, the graphic layout of the visualization screen is very important. The client or operator is not interested in advanced scripts. They are interested in nice, clear and intuitive screens. The subtitles, diodes and buttons are not enough to create elegant visualization screens. It is necessary to use graphics and most SCADA and HMI panels have the possibility to implement images, so why not use it.
This article is addressed to the people starting their adventure with creating visualizations. Experienced SCADA programmers certainly have their own patents and graphic methods, but maybe they will also find something they can use in their everyday work with visualizations.
Raster and vector graphics
Computer graphics can be divided into two main types: waster graphics and vector graphics. Their goal is common, to save a certain image in the form of bits, but the approach to this saving is completely different. We will try to briefly describe these typed of graphics and show the main differences.
Raster graphics is the way of presenting an image using rectangular grid of regularly placed pixels of the same size. Each pixel contains information about its color. We have contact with raster graphics everywhere. It is used practically on every internet portal. All digital photography is based on raster graphics. The popular file formats include, among others: JPEG, PNG, GIF, BMP, TIFF, ICO.
In vector graphics, to describe the image, objects consisting of point, lines and geometric figures placed in the coordinate system are used. Each object has certain parameters describing color, filling, line thickness, degree of transparency. This approach to saving allows for zooming or rotating the image, which in the case of raster graphics will result in so-called “pixelosis”.
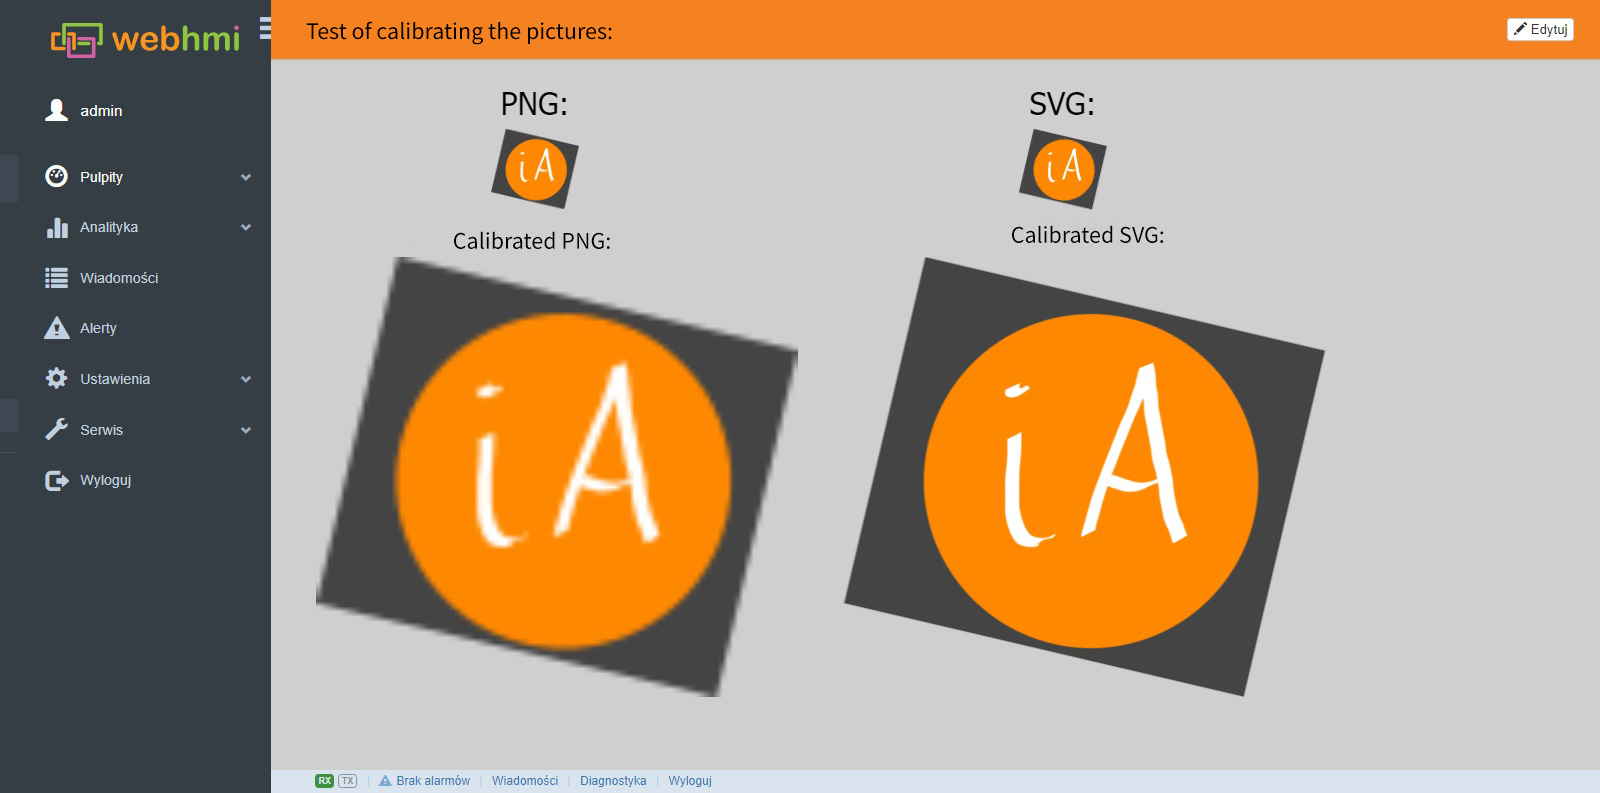
As you can see in the example above, enlarging the PNG image resulted in the appearance of visible pixels and general loss of quality. In the case of SVG images, it did not lose its quality, but also additional details are visible. The above example was wade in the WebHMI interface (SCADA multicontroller) about which you can read more at ZestaPro website.
However, vector graphics are not suitable for saving photos on which we have lots of details and shadows. The lower popularity of this type of graphics is associated with the incompatibility of some formats with various devices and application, and people getting used to raster graphics. Common types of vector file extensions are: AI, CDR, EPS, PDF, SVG, SWF. As a curiosity, it can be added that vector graphics can be opened in notebook and we can change the coordinated of points or color parameters.
When choosing the format of graphics which we want to use on the visualization panels, we have to take into account the possibility of using a transparent background, because nobody wants to see on their screens ugly, white rectangles around each graphic. Transparent background is available in images with PNG, GIF or ICO extensions and in all vector graphic formats, including SVG, which we recommend for use in the WebHMI.
Creating own graphics
Answering the question the title of this article, the best source of graphics for visualization screens is their creating by yourself. We do not have to worry about copyrights, we are not limited by elements from the default libraries implemented to our SCADA, and we have full control over the appearance of these graphics and symbols. I am sure that many people think that they are only programmers, not artists, and they cannot draw, but after all anyone can draw better or worseJ. Our current trend of minimalism and simplicity of appearance also works in our favor, which says: “the simpler the better”. Also, search in Google for the phrase “flat design” – it’s an increasingly popular style.
There are a lot of programs for creating and editing graphics, paid or free. In this article, I will present four free options that contain many advanced features and give effects similar to those paid and often very expensive programs.
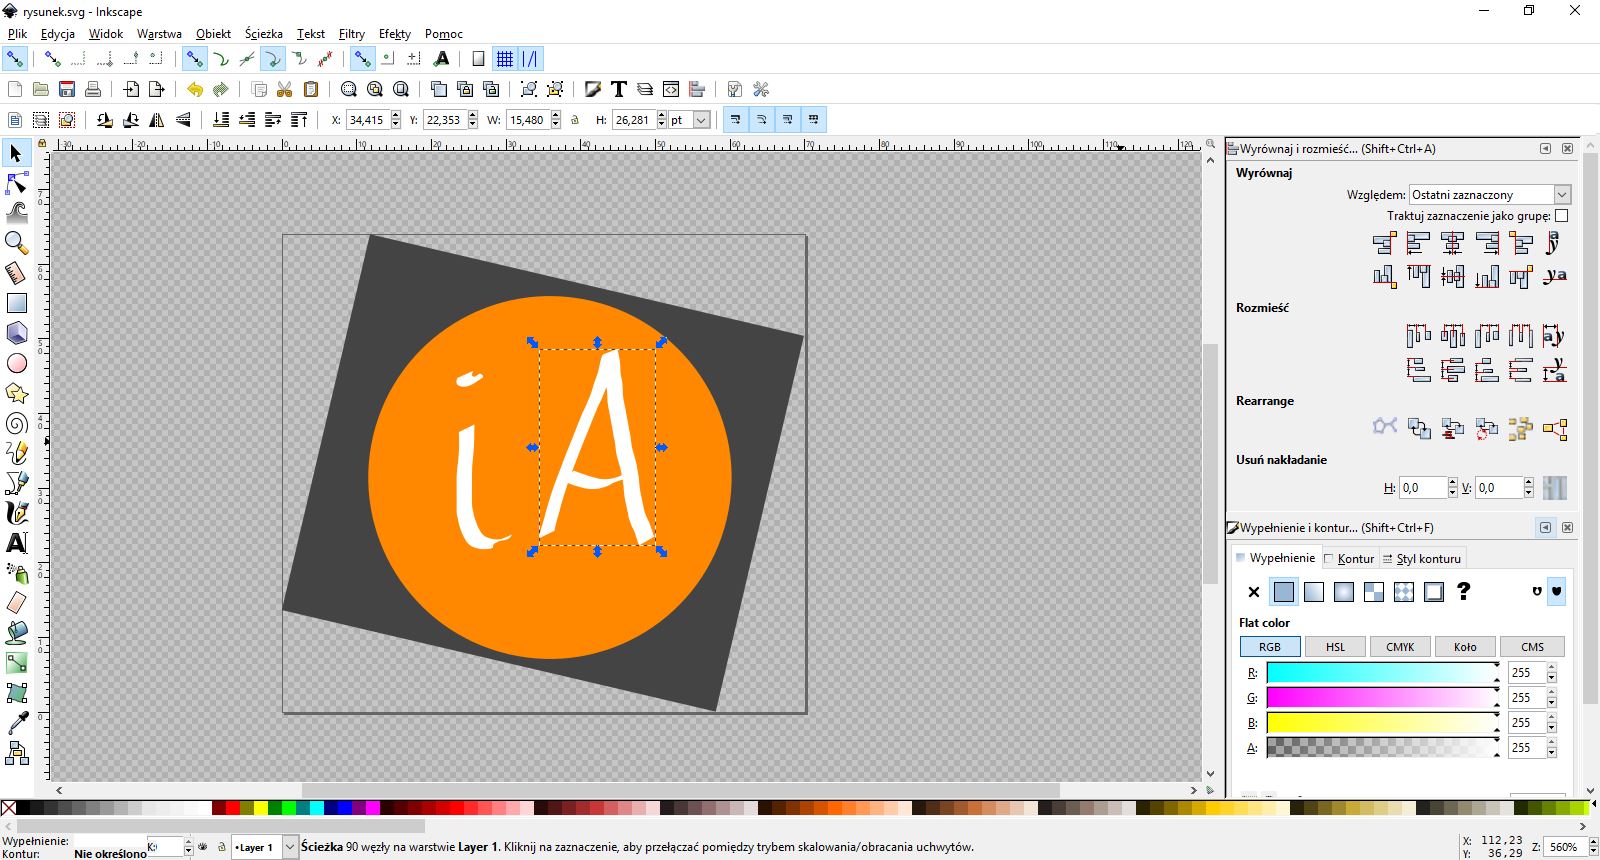
- Inkscape
Inkscape is a free program for creating vector graphics. It contains all useful functions for creating very advanced vector graphics, and at the same time is very simple in use. You can find many online tutorials showing the first steps with this program and it’s enough to start creating your own vector graphics. Created images can be saved in SVG format or as raster graphic in PNG. Link for downloading this program is attached here.
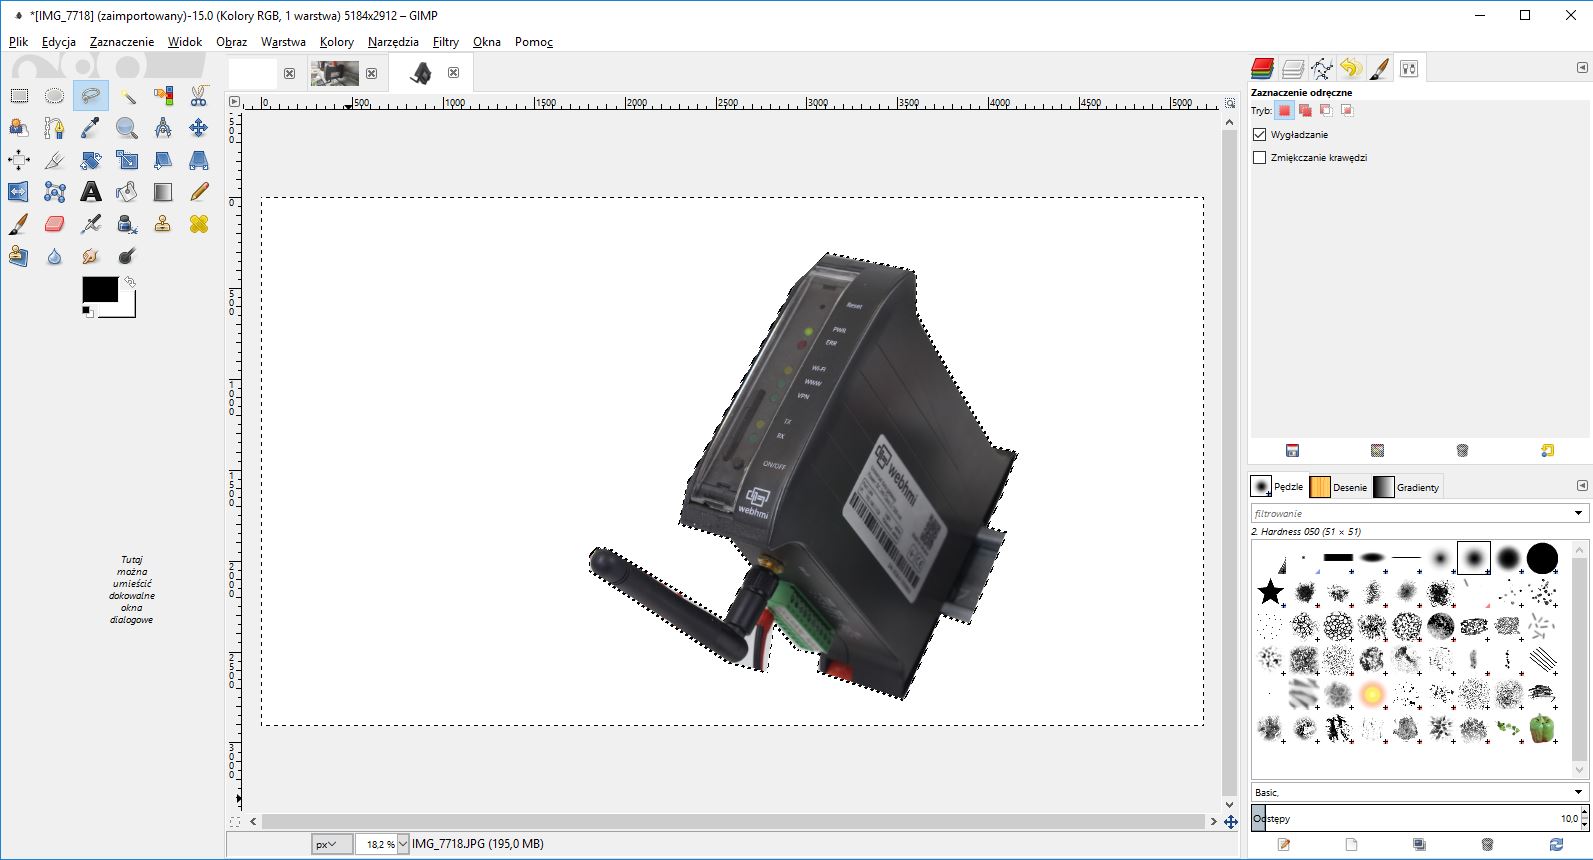
- GIMP picture editor
GIMP is a program for raster graphics editing. It’s not appropriate for creating new graphics from the beginning, but it does not mean that you can’t do it. GIMP should be treated as a free equivalent of PhotoShop, which is much more useful for image editing, for example when we want to cut an object from the picture, change its proportions, add another element or remove background from the image. Just like in the case of Inscape, here we can also find many tutorials, and on various forums we will get answers to practically every question bothering us. GIMP supports a number of graphic formats, including those that interest us most: PNG, GIF, ICO. Installation files for this program can be found here.
- ScreenToGif
ScreenToGif is a small and simple grogram for creating images with GIF extension. The name of this program reveals the main function, which is, recording the screen and saving the recording as a GIF image. In addition, we can also import several static images, set the time between consecutive frames and save the animation created as GIF. If your SCADA supports this file format, ScreenToGif will allow you to quickly create the images you need. Download link.
Yes. This gif was created in this program 🙂
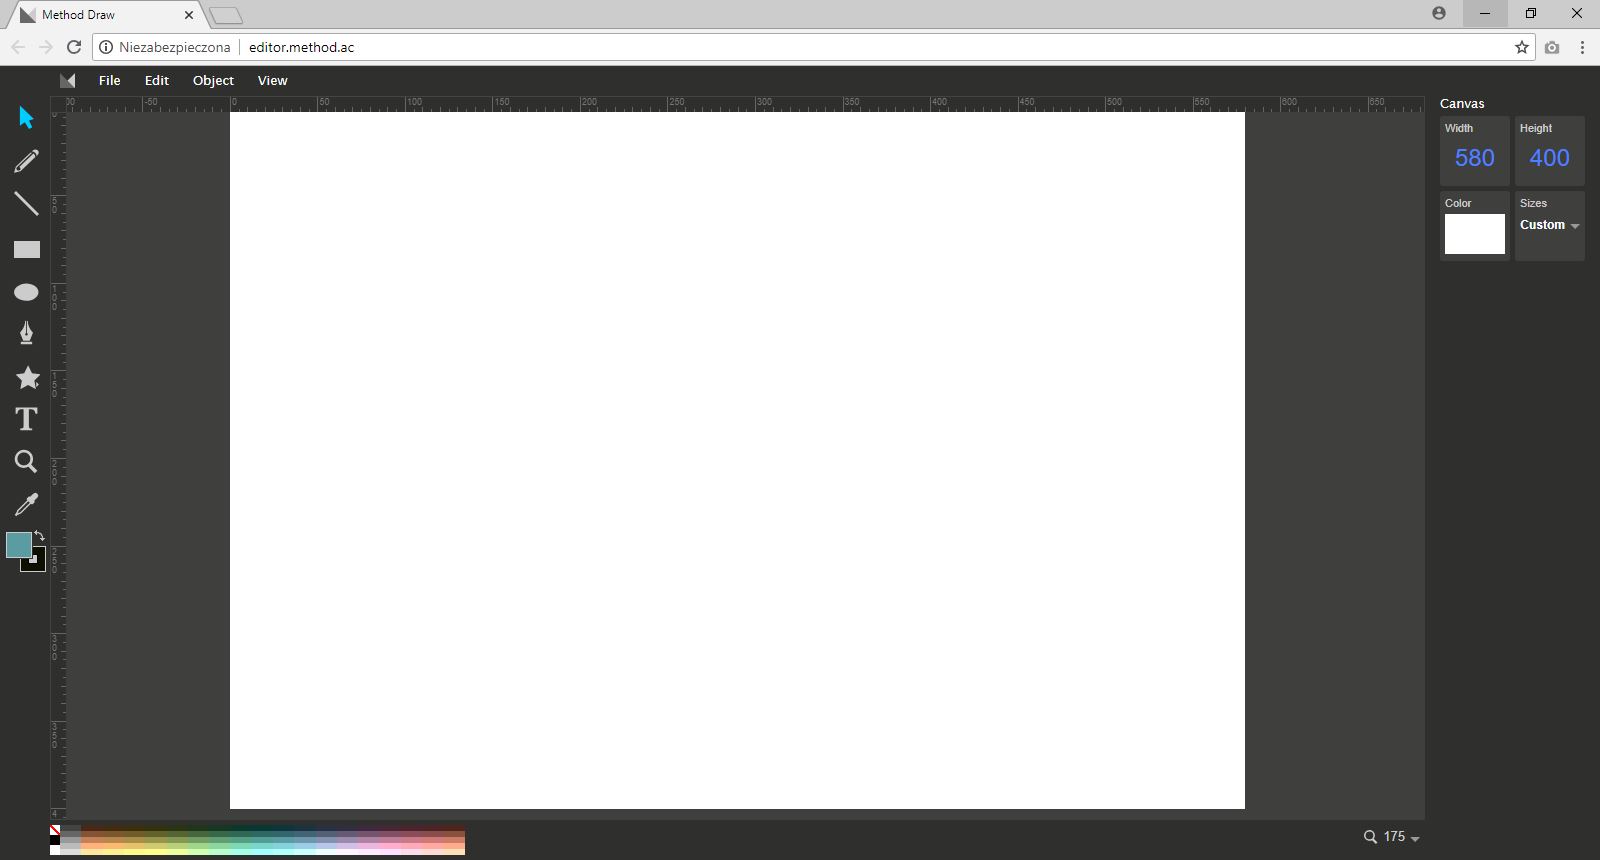
- Method Draw – online editor for vector graphics
The last point on this list is some kind of fun fact. It is a vector graphic browser editor. It is not as extensive as Inkscape or other vector graphics programs, but it is certainly enough to quickly prepare a simple graphic with some inscription. The editor can be found in this link.
Libraries with free graphics
What if we don’t want to draw our own symbols or we need a symbol of a gear for now? We can use from online graphics and symbols libraries. I will present a few interesting websites, where you can look for such a graphics.
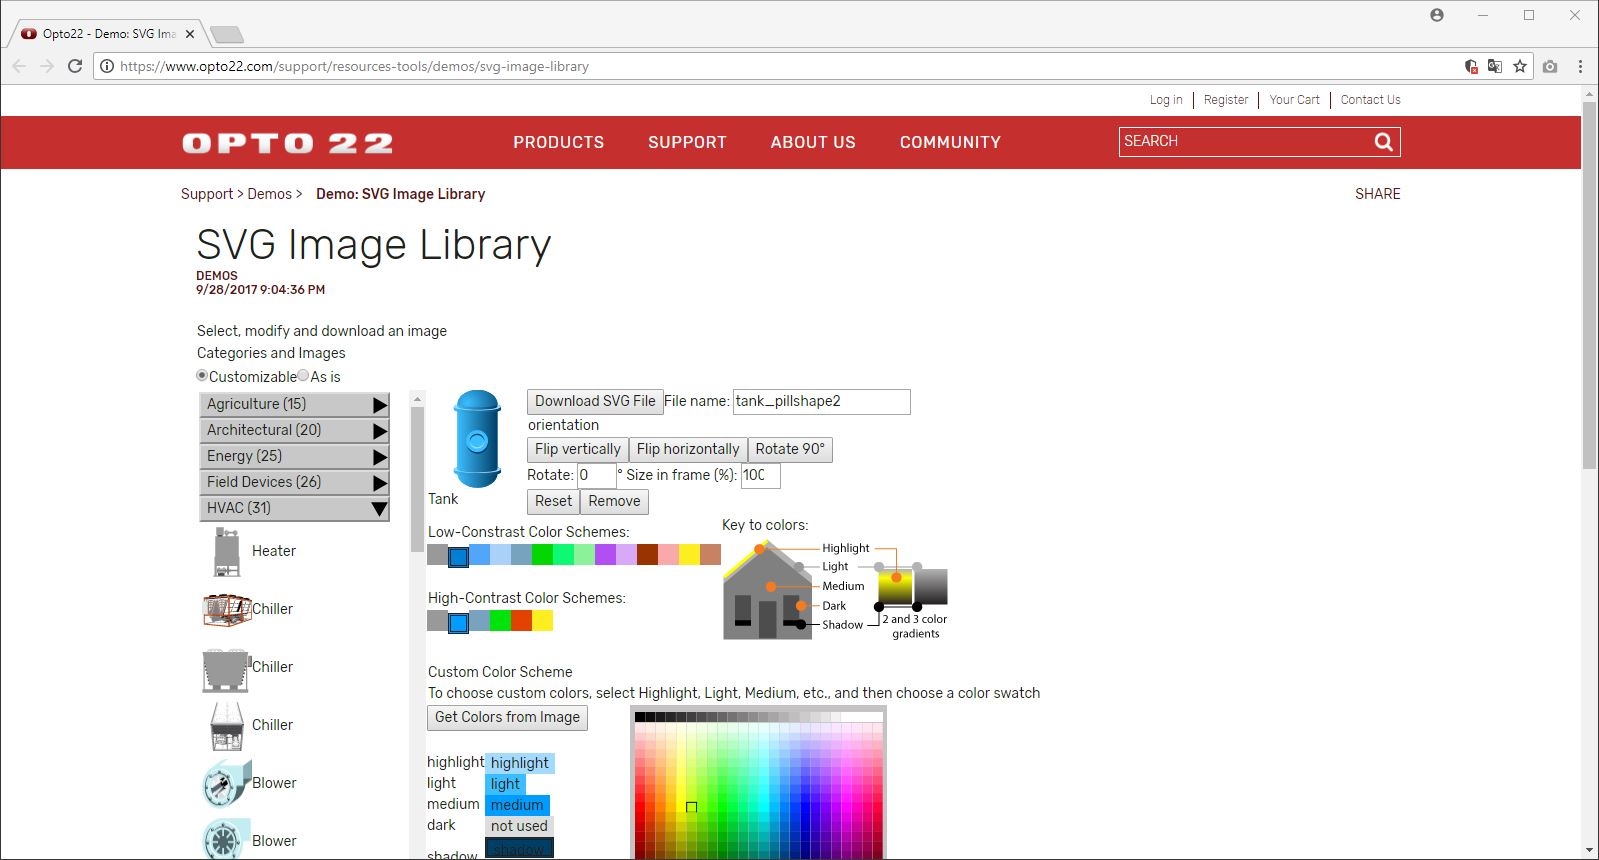
- Opto22
On opto22.com website we will find a few hundreds of graphics prepared for the visualization of industrial processes. All images are in SVG format, which can additionally transform or edit the colors before downloading. All available images are free and do not require authorship.
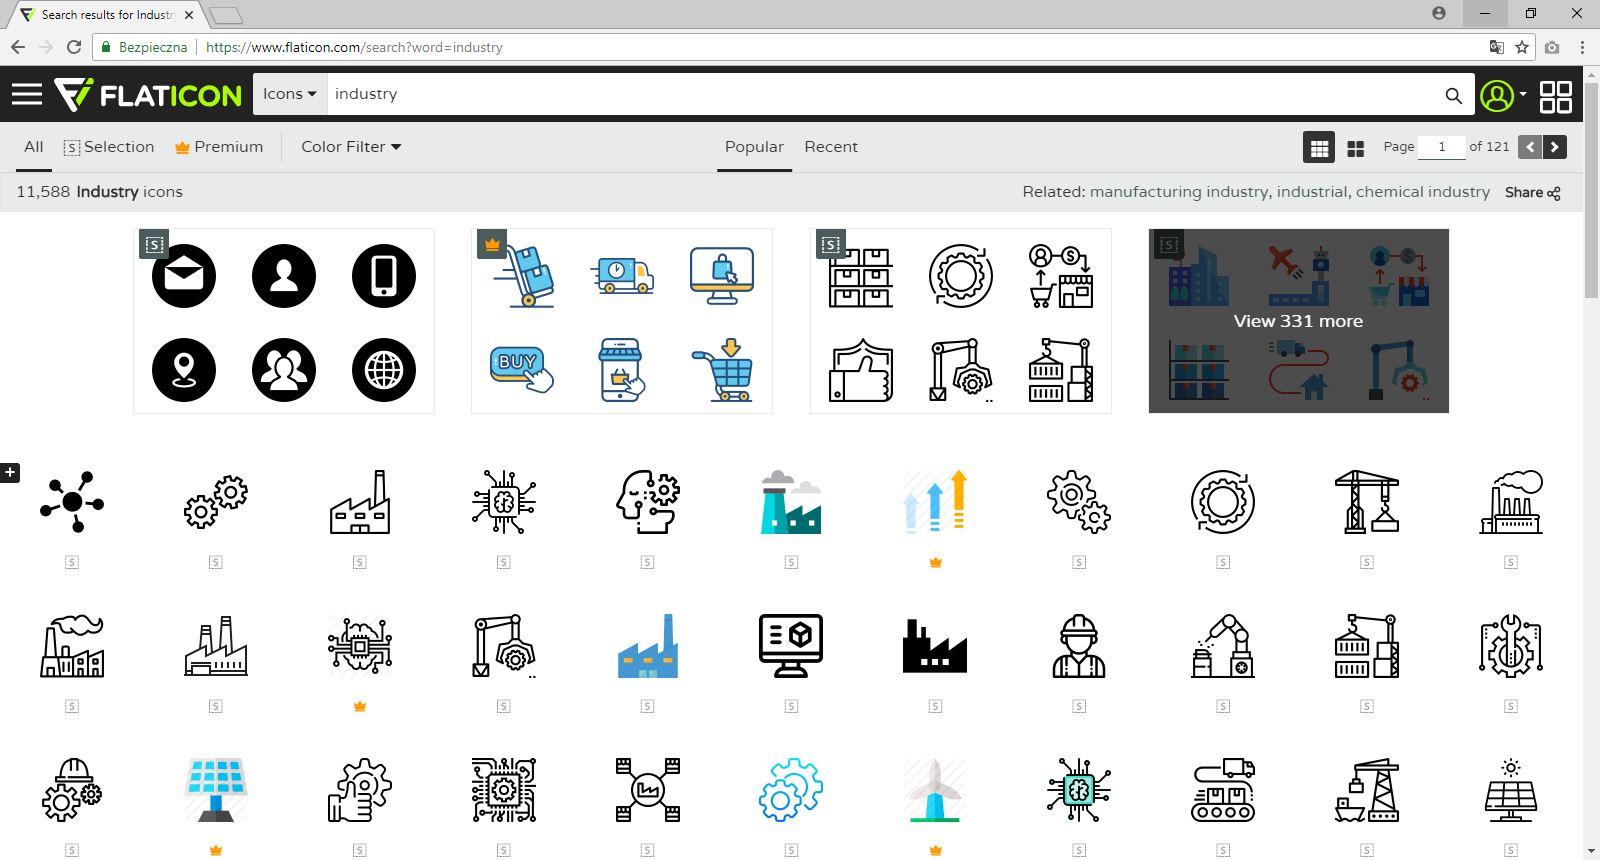
- Flaticon
Flaticon is a website with nearly a million icons and symbols form various thematic sections. When searching for terms such as “cog”, “industry” or “reservoir” we will easily find many graphics. We can download any graphics as SVG, PNG, PSD or EPS files, and the use of these graphics for commercial purposes is possible after recognizing authorship.
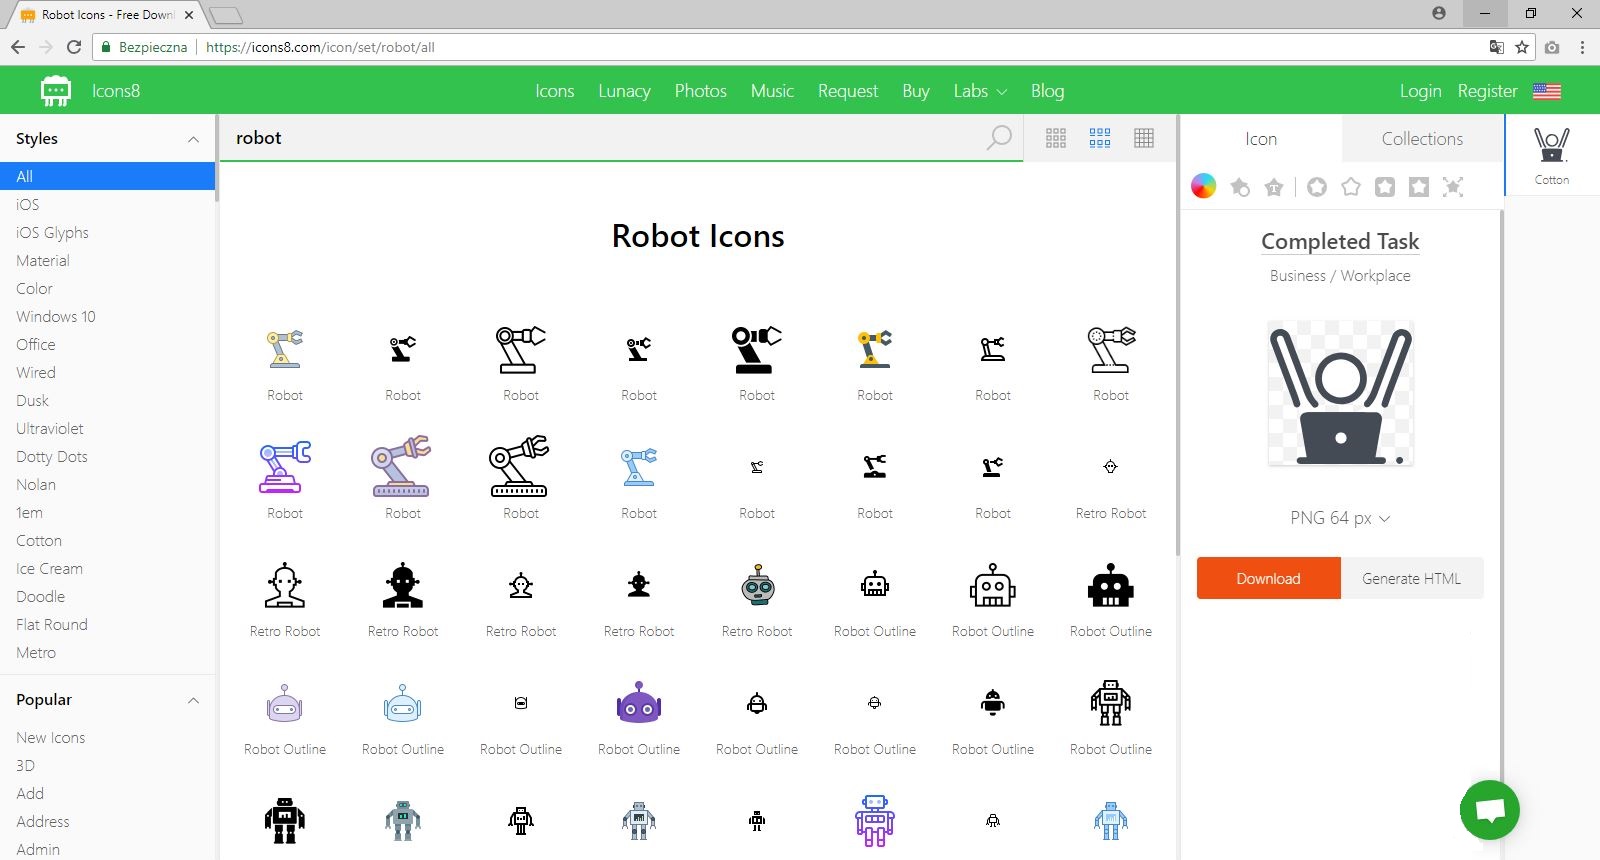
- Icons8
On Icon8 there are over 80,000 pictures that are just waiting to be used on visualization screens. We can change the color of each symbol or add text before downloading. You can download images of limited size for free, and only in GIF format, and if you want to use such a picture you have to recognize the authorship.
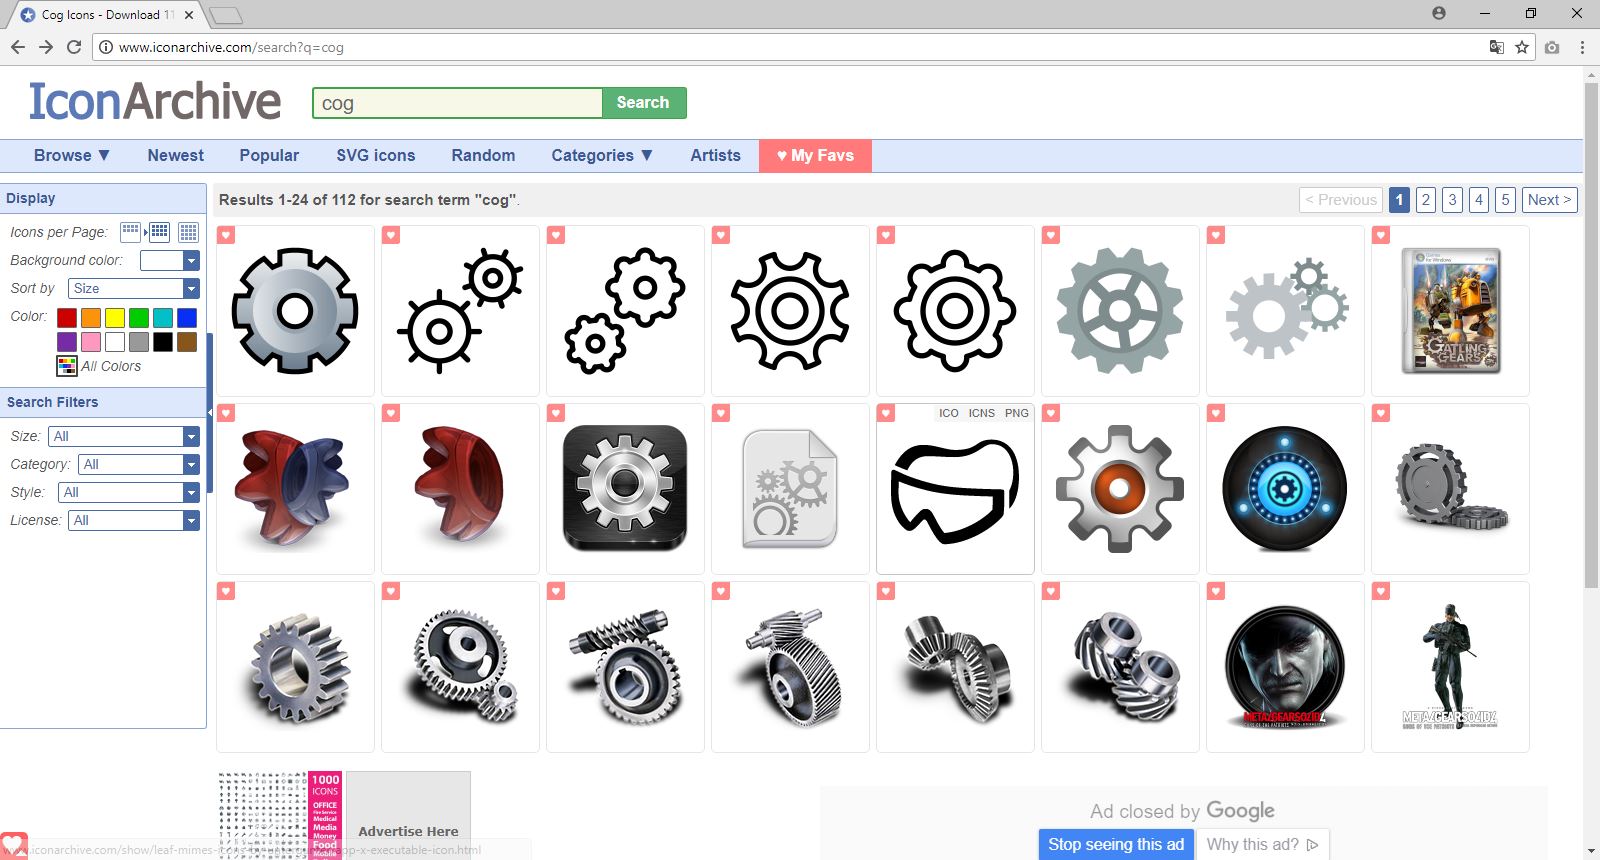
- Iconarchive
Iconarchive is a platform for searching graphics and symbols from various sources. Their database contains over 700,000 pictures. Available formats, sizes and licenses are different and depend on the selected graphics.
- OpenAutomationSoftware
On the openautomationsoftware.com website it is possible to download a set of 500 graphics to be used on the visualization screen. We can find here elements such as engines, pumps, tanks, valves, pipelines, and each element in available in several colors and sizes. The “price” of these graphics is your data provided during registration.

Summary
I hope that the information in this article will be useful for future work with visualization screens. Remember that the best end result is achieved by creating your own graphics for visualizations, and graphic libraries can be very useful in finding inspiration for created images. We also invite you to familiarize yourself with the proposed SCADA WebHMI controller that imports SVG vector graphics and others.
Do you have any interesting SCADA graphics source? Share it with us in the comment section!